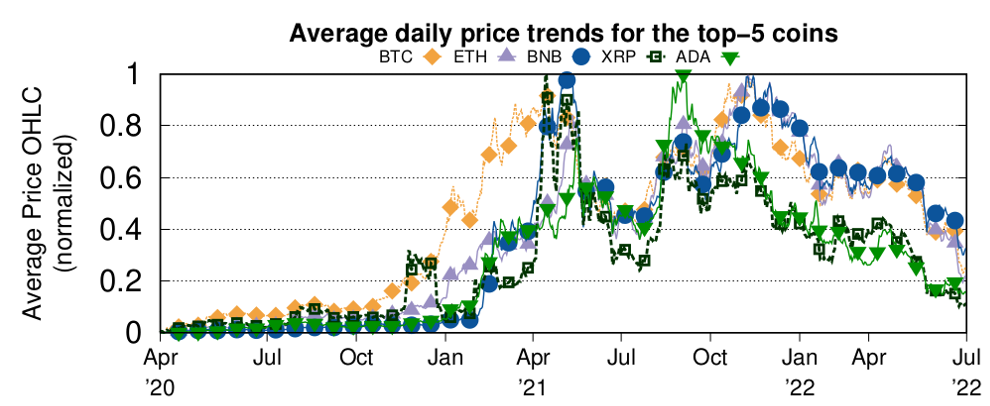
The trading prices of cryptocoins are extremely volatile and fluctuate considerably over time, way more than traditional “fiat” currencies. There are many possible reasons for this behavior: lack of an adequate regulation, with market prices determined only by the amount of supply and demand, inherent speculative nature of these assets, absence of an institutional guarantor (there is no “central bank” for cryptos), pump-and-dump actions enacted by large stakes (i.e., whales owning large percentages of the issued coins), and more. For instance, the Figure below depicts such volatility spanning more than 24 months.

We see the trends of OHLC (open-high-low-close) daily prices on Binance (a large cryptocoin exchange) for the top-5 most-traded cryptos (BTC, ETH, BNB, XRP, ADA) since April 2020. Even within short time-frames (i.e., 6 months between April and October 2021) the price variation are remarkable! We also observe the tendency, for these cryptocoins, to move together: we observe a global upward trend until April 2021, a short-term downward trend until July 2021, followed by an upward trend until September 2021. Finally, April-July 2022 is a time segment characterized by an overall market price drop. We call this phenomenon co-movement, and it can be quantified as the cross-correlation between the different cryptocoins over a specific time frame.
The nature of such co-movement, however, remains largely unexplored in literature. In one of our recent studies, we explored the correlation trends among a large-set of cryptocoins (the top-61 for market volume listed in a leading aggregator, CoinMarketCap). We identified Bitcoin (BTC) and Ether (ETH) as the two main coins (market leaders), and 59 altcoins (alternatives to the main coins). Our study shows that the vast majority of such altcoins are strongly correlated with the two market leaders (technically, we measure a Pearson coefficient close to 1).
Hence, we leverage these correlations to forecast (i.e., predict) the trading prices of BTC and ETH by observing the trends of highly-correlated altcoins. However, this is a challenging task. Assets such as cryptocoins and their trading prices are characterized by an extreme degree of uncertainty and volatility. In fact, those are commonly considered random walks (from economist Fama’s theory), and thus unpredictable by nature.
In our ongoing study, we leverage the trading price trends of a set of 16 highly-correlated altcoins observed between March 2020 and May 2022 to forecast the price trends of BTC and ETH in the month following the observed period, i.e., June 2022, collecting public datasets from Binance.
To overcome the random walk hypothesis and provide reliable forecasts of BTC and ETH trading prices, we resort to machine learning (ML) techniques, specialized for financial time-series modeling and forecasting, rather than traditional econometrics approaches. We compared two families of state-of-the-art ML techniques: Gradient-Boosting Machines (GBMs) and Recurrent Neural Networks (RNNs). Our study indicates that RNNs are a better choice for this task, achieving better accuracy in detecting small and sudden short-term changes and modeling unstable trends. The most accurate ML forecaster for cryptocoin trading prices proved to be the Gated Recurrent Unit (GRU), a type of RNN efficient in modeling both long-term dependencies trends and short period drifts.
The figure below shows a comparison between the real, observed trading price trends of BTC/ETH (ground truth from the dataset) and the forecasted values from the GRU. The predictions are close to the ground truth, and offering concrete evidence that these ML techniques can be well suited to model cryptocoin price series. By observing and leveraging co-movement trends within the market, we can predict even the unpredictable! A preliminary version of this study has been presented earlier this year at the IFIP DAIS 2022 conference and appeared in the proceedings of the conference.


For a more detailed analysis, please read De Rosa, P., Schiavoni, V. (2022). Understanding Cryptocoins Trends Correlations. In: Eyers, D., Voulgaris, S. (eds) Distributed Applications and Interoperable Systems. DAIS 2022.
Proposition de citation : Schiavoni Valerio/De Rosa Pasquale, Can we predict the unpredictable? Forecasting cryptocoin trading prices with Machine Learning techniques, Blog du LexTech Institute, 29.11.2022


